Part 4: Deploy a Module
Goal: Deploy your inspector to run on the machine autonomously.
Skills: Module packaging, registry deployment, tabular data capture.
Time: ~10 min
What You’ll Do
In Part 3, you built inspection logic that runs from your laptop. That’s great for development, but in production the code needs to run on the machine itself—so it works even when your laptop is closed.
The module generator already created most of what you need:
cmd/module/main.go—module entry pointmeta.json—registry metadata- Model registration in
init()
You just need to build, package, and deploy.
4.1 Review the Generated Module Structure
The generator already created everything needed to run as a module. Let’s review what’s there.
cmd/module/main.go
func main() {
    module.ModularMain(
        resource.APIModel{API: generic.API, Model: inspectionmodule.Inspector},
    )
}
This connects your module to viam-server and registers the inspector model. When you add this service to your machine configuration, viam-server uses this entry point to create and manage instances. You don’t need to modify it.
What is a model?
In Viam, a model is a specific implementation of an API—identified by a triplet like your-namespace:inspection-module:inspector. This can be confusing because we also refer to ML models as “models.” When you see “model” in the context of modules and resources, it means the implementation type, not a machine learning model.
module.go provides model registration in init():
The generator created an init() function that registers your model:
var Inspector = resource.NewModel("your-namespace", "inspection-module", "inspector")

func init() {
    resource.RegisterService(generic.API, Inspector,
        resource.Registration[resource.Resource, *Config]{
            Constructor: newInspectionModuleInspector,
        },
    )
}
Note the two uses of “inspector” here:
Inspector(capital I)—the Go variable name, exported somain.gocan reference it"inspector"(lowercase, in quotes)—a string that becomes the third part of the model tripletyour-namespace:inspection-module:inspector
This init() function runs automatically when the module starts, telling viam-server how to create instances of your service.
meta.json Registry metadata:
{
  "module_id": "your-namespace:inspection-module",
  "visibility": "private",
  "models": [
    {
      "api": "rdk:service:generic",
      "model": "your-namespace:inspection-module:inspector"
    }
  ],
  "entrypoint": "bin/inspection-module"
}
This tells the registry what your module provides.
The key pattern
The generator created module infrastructure. You added business logic (detect) and exposed it through DoCommand. The same NewInspector constructor works for both CLI testing and module deployment.
4.2 Build and Upload Your Module
Update the module’s model list:
The module was already registered in the Viam registry when you ran viam module generate in Part 3 (you answered “Yes” to “Register module”). Now you need to update its model metadata. First, build a local binary:
make
Then run update-models to detect which models your module provides and update meta.json:
viam module update-models --binary /full/path/to/bin/inspection-module
Replace /full/path/to/ with the absolute path to your module directory.
Cross-compile for the target platform:
Your module will run inside a Linux container, not on your development machine. Even if your Mac and the container both use ARM processors, a macOS binary won’t run on Linux—you need to cross-compile. Cross-compilation also requires disabling CGO (Go’s C interop) and using the no_cgo build tag.
CGO_ENABLED=0 GOOS=linux GOARCH=arm64 go build -tags no_cgo -o bin/inspection-module ./cmd/module
CGO_ENABLED=0 GOOS=linux GOARCH=amd64 go build -tags no_cgo -o bin/inspection-module ./cmd/module
CGO_ENABLED=0 GOOS=linux GOARCH=amd64 go build -tags no_cgo -o bin/inspection-module ./cmd/module
go build -o bin/inspection-module ./cmd/module
No cross-compilation needed—you’re already on Linux.
go build -o bin/inspection-module ./cmd/module
No cross-compilation needed—you’re already on Linux.
Package for upload:
tar czf module.tar.gz meta.json bin/
Upload to the registry:
The --platform flag must match the architecture you compiled for:
viam module upload --version 0.0.1 --platform linux/arm64 --upload module.tar.gz
viam module upload --version 0.0.1 --platform linux/amd64 --upload module.tar.gz
viam module upload --version 0.0.1 --platform linux/amd64 --upload module.tar.gz
viam module upload --version 0.0.1 --platform linux/amd64 --upload module.tar.gz
viam module upload --version 0.0.1 --platform linux/arm64 --upload module.tar.gz
4.3 Add the Module to Your Machine
Add the inspector service:
- In the Viam app, go to your machine’s Configure tab
- Click + next to your machine part
- Select Component or service
- Search for your model (for example,
your-namespace:inspection-module:inspector) - Name it
inspector-service - Click Create
When you add a service from the registry, the module that provides it is added automatically.
Configure the service attributes:
{
  "camera": "inspection-cam",
  "vision": "vision-service"
}
Click Save.
Verify it started:
- Go to the Logs tab
- Look for startup messages from the inspector module
- You should see it initialize and connect to the camera and vision service
Test the inspector:
- In the CONFIGURE tab, click on
inspector-serviceto open its configuration panel - Expand the Test section at the bottom
- Expand DoCommand and enter
{"detect": true} - Click Execute
- You should see a response with
labelandconfidencevalues - Click Execute several more times to see different detections as cans pass beneath the inspection-cam

The module is now ready. You’ll configure automatic detection in the next section.
4.4 Configure Detection Data Capture
In Part 2, you captured images from the vision service. Those images are great for visual review, but they’re binary data—you can’t query them with SQL. Now you’ll configure tabular data capture on your inspector’s DoCommand, which will let you query detection results.
Add inspector-service as a data manager dependency:
The data manager needs to know about your inspector service before it can capture data from it. You’ll add this dependency in the JSON configuration.
In the CONFIGURE tab, click JSON in the upper left
Find the
data-serviceentry in theservicesarrayAdd
"depends_on": ["inspector-service"]to the data-service configuration:{ "name": "data-service", "api": "rdk:service:data_manager", "model": "rdk:builtin:builtin", "attributes": { ... }, "depends_on": ["inspector-service"] }Click Save
This tells viam-server to wait for inspector-service to initialize before the data manager tries to capture data from it.
Enable data capture on the inspector:
In the CONFIGURE tab, click on
inspector-serviceto open its configuration panelFind the DATA CAPTURE section and click Add method
Select the method:
DoCommandSet Frequency (hz) to
0.5(captures every 2 seconds)In the Additional parameters section, add the DoCommand input:
{
  "detect": true
}
Save your configuration
This configuration tells the data manager to periodically call DoCommand({"detect": true}) on your inspector and capture the response—which includes label and confidence.
Query detection results:
After a few minutes of data collection, you can query the results:
Open the Data tab in the Viam app
Click Query
Select SQL as your query language
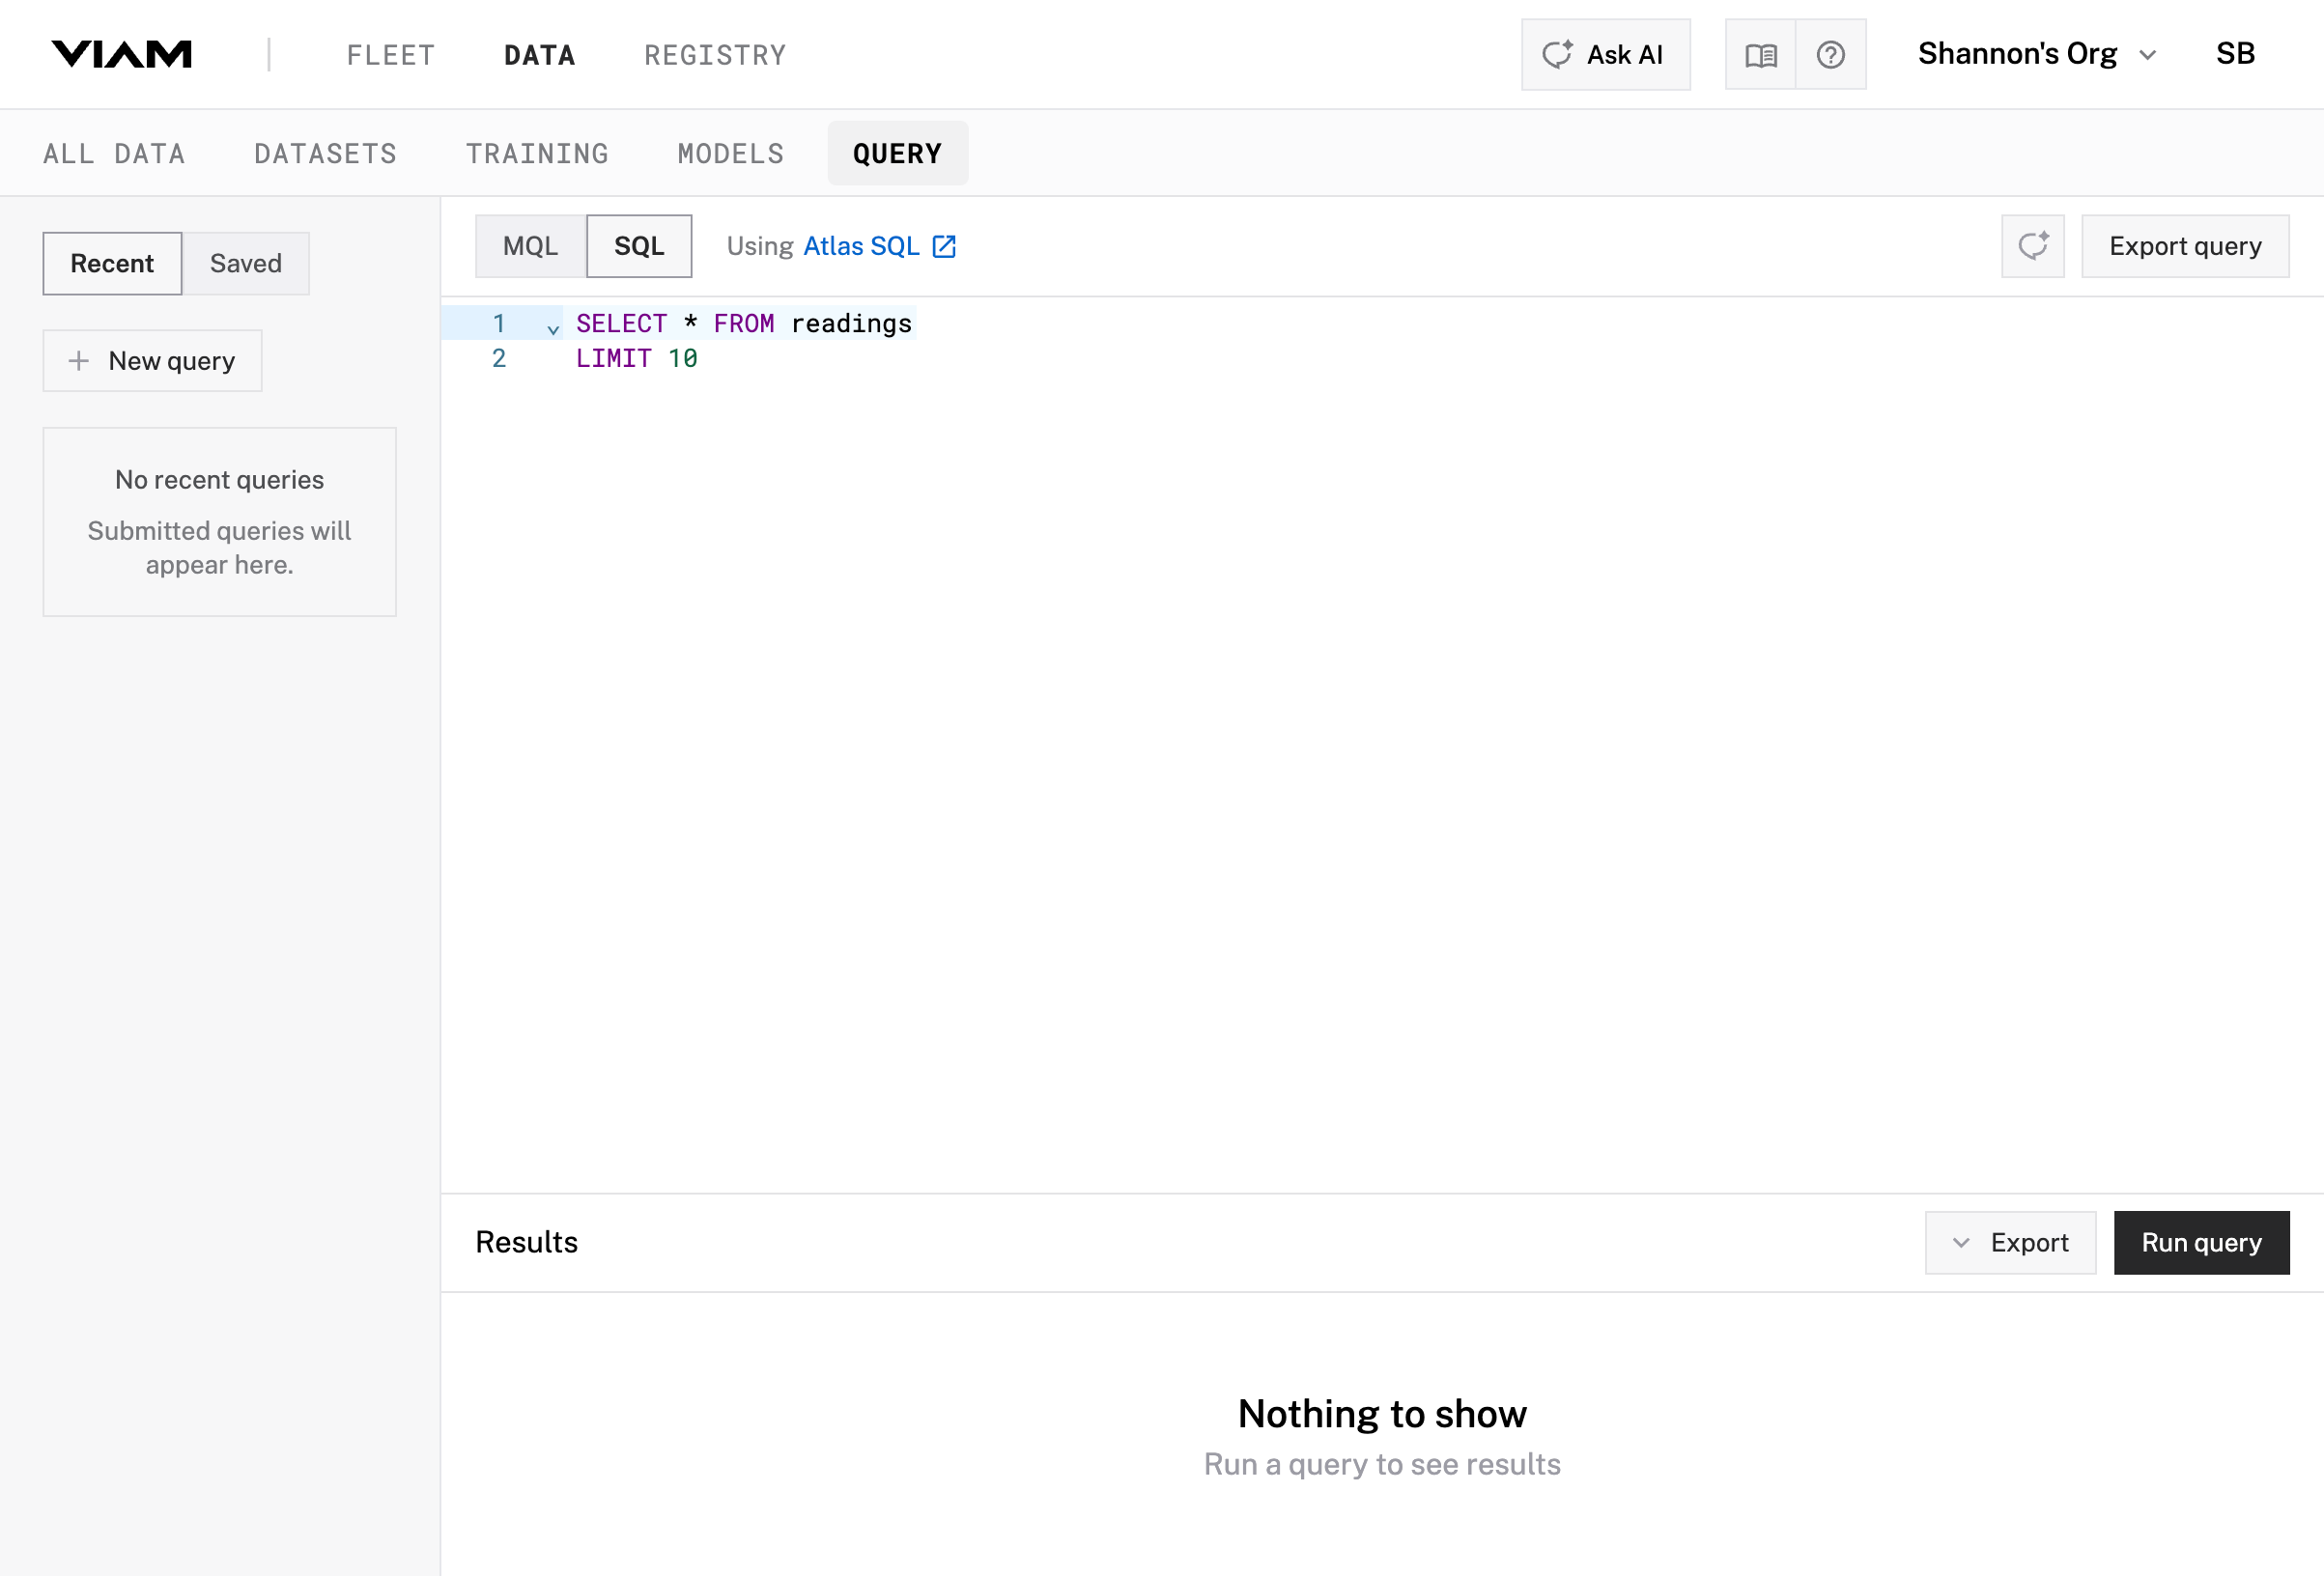
Run a query to see recent detections:
SELECT time_received, component_name, data
FROM readings
ORDER BY time_received DESC
LIMIT 10
You can also filter to show only failures:
SELECT time_received,
       data.docommand_output.label,
       data.docommand_output.confidence
FROM readings
WHERE data.docommand_output.label = 'FAIL'
ORDER BY time_received DESC
LIMIT 10

Understanding the data structure:
Each captured detection is stored as a JSON document. Here’s what the data looks like:
{
  "component_name": "inspector-service",
  "component_type": "rdk:service:generic",
  "method_name": "DoCommand",
  "time_received": "2026-02-02T02:23:27.326Z",
  "data": {
    "docommand_output": {
      "label": "PASS",
      "confidence": 0.9999136328697205
    }
  },
  "additional_parameters": {
    "docommand_input": {
      "detect": true
    }
  },
  "organization_id": "...",
  "location_id": "...",
  "robot_id": "...",
  "part_id": "..."
}
The key fields for analysis are nested under data.docommand_output:
label: The detection result—PASS,FAIL, orNO_DETECTIONconfidence: How confident the model is (0.0 to 1.0)
Querying with MQL:
You can also query using MQL (MongoDB Query Language), which is useful for aggregations. Select MQL in the Query interface. For example, to count failures by hour:
[
  {
    $match: {
      component_name: "inspector-service",
      "data.docommand_output.label": "FAIL",
    },
  },
  {
    $group: {
      _id: { $dateTrunc: { date: "$time_received", unit: "hour" } },
      count: { $sum: 1 },
    },
  },
  { $sort: { _id: -1 } },
];
You’ll use MQL aggregation pipelines in Part 5 to build dashboard widgets.
Two types of captured data
You now have two complementary data streams:
- Vision service images (Part 2): Visual records for review and model retraining
- Inspector tabular data (this section): Queryable detection results for analytics
The images show what the system saw; the tabular data tracks what it decided.
4.5 Summary
You deployed your inspection logic as a Viam module:
- Reviewed—the generator already created module structure and registration
- Deployed—built, packaged, uploaded, configured
- Configured data capture—detection results are now queryable
The development pattern:
- During development: CLI runs locally, uses remote hardware (fast iteration)
- In production: Module runs on machine, same code (autonomous operation)
Your inspection system now runs 24/7 detecting defects without your laptop connected.
Continue to Part 5: Productize →
Was this page helpful?
Glad to hear it! If you have any other feedback please let us know:
We're sorry about that. To help us improve, please tell us what we can do better:
Thank you!